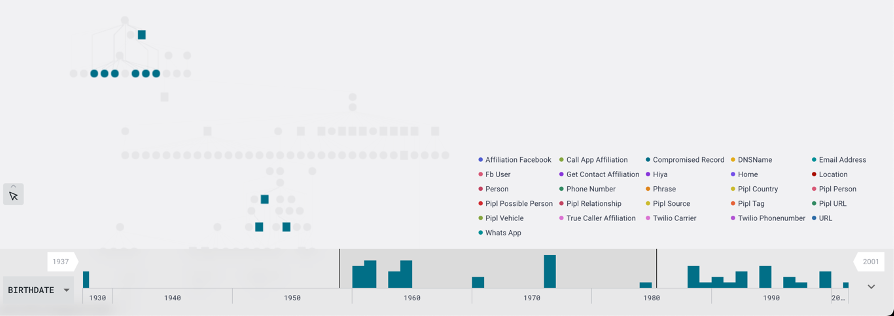
Histograms provide a visual method for applying time and number filters in Maltego Graph (Browser). This feature becomes available when the graph contains properties with numeric or time-based values.
When activated, investigators can select a specific property to analyze. Maltego Graph (Browser) then displays a histogram that represents the distribution of values across that property. Investigators can narrow the focus by adjusting the time or number range using draggable black markers on the histogram. This allows them to quickly isolate and highlight the most relevant Entities within that specified range.